> For the complete documentation index, see [llms.txt](https://docs.net2grid.com/llms.txt). Markdown versions of documentation pages are available by appending `.md` to page URLs; this page is available as [Markdown](https://docs.net2grid.com/net2grid-energy-ai-cloud/functionality/solar-production.md).
# Solar Production
## Behind-the-Meter Solar Intelligence
NET2GRID EnergyAI® detects and quantifies gross solar PV production directly from standard smart meter data, **without requiring any hardware integration with the solar inverter.**
Standard smart meters natively measure only net import and export. Without accounting for locally generated energy that is consumed behind the meter, household consumption patterns appear distorted, leading to misclassified loads and incomplete insights. NET2GRID EnergyAI® solves this by mathematically reconstructing the home's true energy balance.
***
## Reconstructing the Energy Balance
The smart meter measurements of a solar-equipped household are affected by the dynamic relationship between solar production and load. During the day, the PV system generates electricity that first supplies the home's appliances. When generation exceeds consumption, the surplus is exported. When consumption exceeds generation, the home imports from the grid.
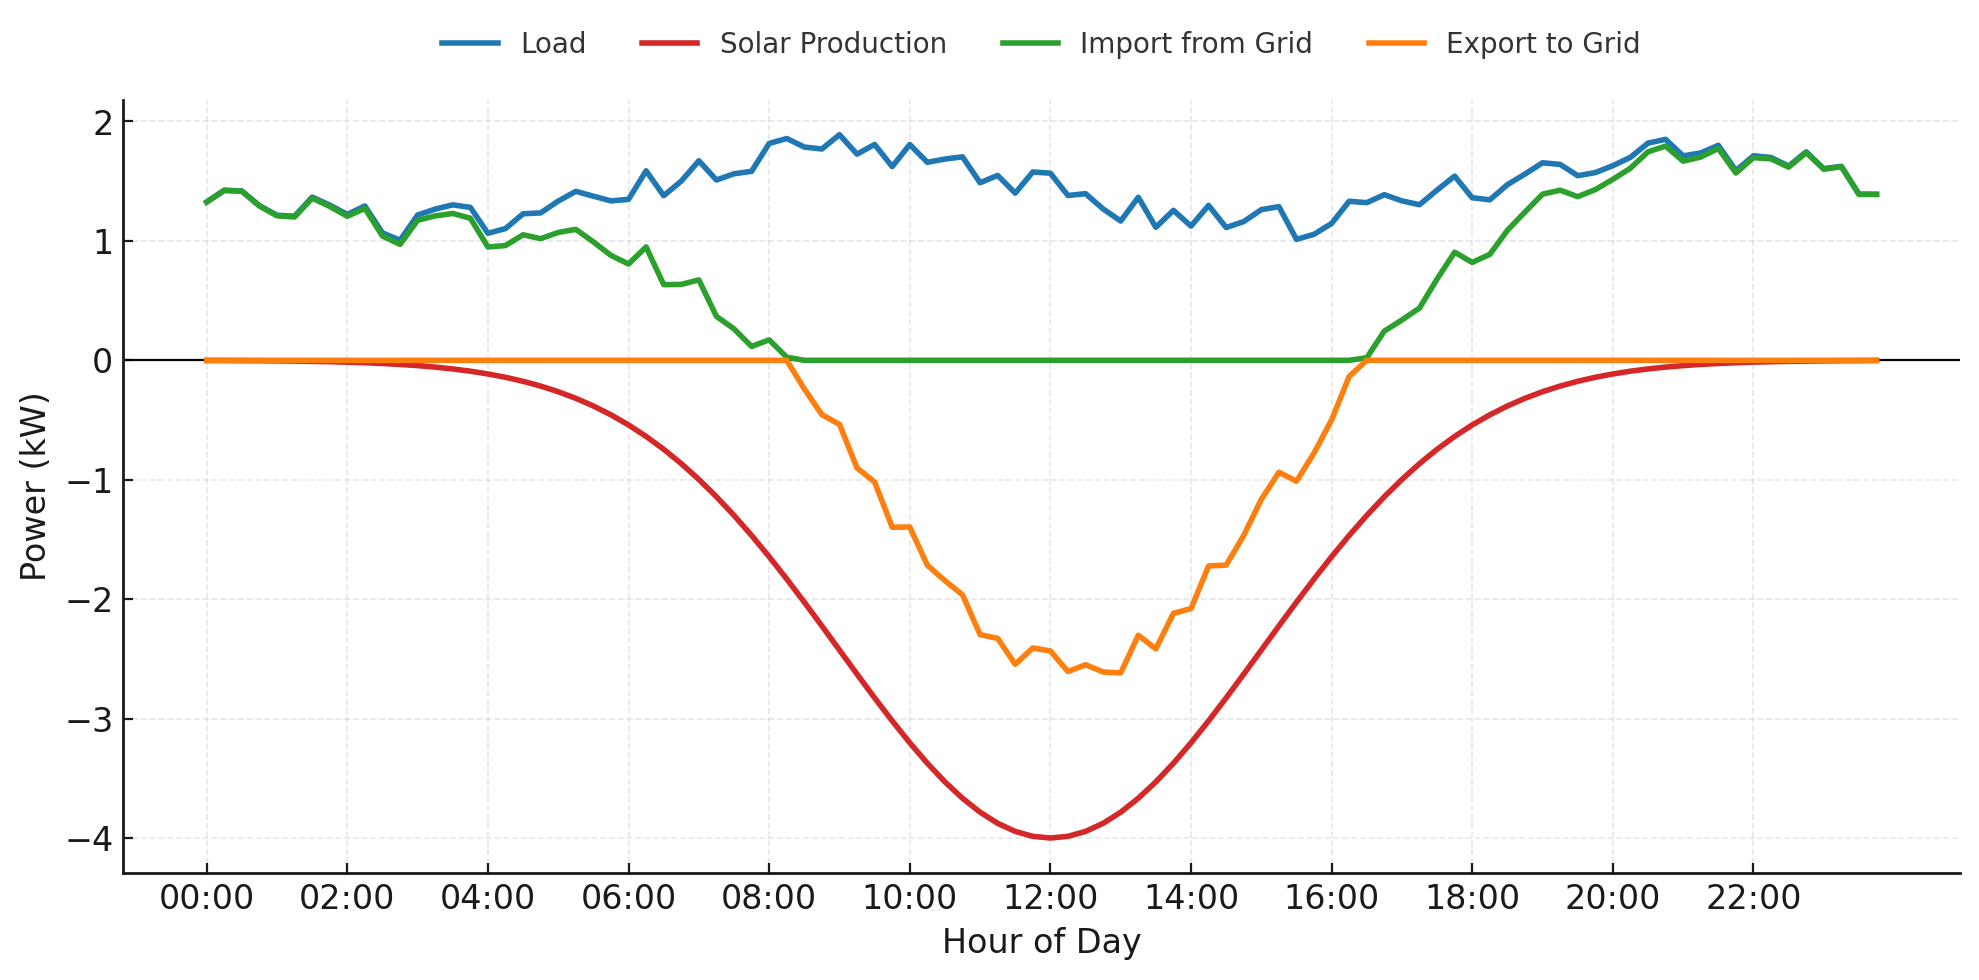
To deliver accurate load disaggregation and solar insights, NET2GRID EnergyAI® reconstructs solar production and load, providing a complete picture of the household:
* **Load:** The true, total energy consumed by the household.
* **Solar Production:** The gross energy generated by the solar PV system.
* **Import from Grid:** The energy drawn from the grid when demand exceeds production.
* **Export to Grid:** The excess solar generation sent back to the network.
The chart below illustrates how these power streams evolve during a typical sunny day.
Figure 1: Power Streams during a typical sunny day
***
## Household-Level Solar Metrics
Once the four energy streams are isolated, NET2GRID EnergyAI® computes a rich set of daily and monthly metrics. These enable utilities and energy retailers to assess system performance, identify self-consumption inefficiencies, and provide transparent, actionable feedback to solar customers.
| Metric | Description | Example Value |
| --------------------------------- | ----------------------------------------------------------------------------------- | ----------------- |
| **Generated Solar Production** | Total estimated gross solar generation for the day. | 30.08 kWh |
| **Solar Production Used On-site** | The portion of generated solar energy consumed behind the meter (self-consumption). | 17.03 kWh (56.6%) |
| **Solar Exported** | The portion of generated solar energy sent back to the grid. | 13.05 kWh (43.4%) |
| **Peak Production Value** | The maximum power generation level reached during the day. | 4,000 W |
| **Peak Production Timestamp** | The exact date and time the peak generation occurred. | 21/07/2025, 12:00 |
| **Monthly Sun-Hours Efficiency** | Production efficiency relative to the system's installed capacity for the month. | 25.1% |
| **Annual Sun-Hours Efficiency** | Production efficiency relative to the system's nominal annual capacity. | 25.1% |
***
## How we deliver this
Each solar production report provides an hour-by-hour array of gross solar production alongside the calculated daily performance metrics.
This format allows you to seamlessly integrate the hourly generation curves and daily insights directly into your mobile app visualizations, CRM, or backend reporting workflows.
Solar Production insights are available in the [Monthly - Grid Intelligence](/net2grid-energy-ai-cloud/delivery-configurations/monthly-grid-intelligence.md) and [Daily - Consumer Intelligence](/net2grid-energy-ai-cloud/delivery-configurations/daily-consumer-intelligence.md) delivery configurations, where you'll also find the link to the interface specifications.
---
# Agent Instructions
This documentation is published with GitBook. GitBook is the documentation platform designed so that both humans and AI agents can read, navigate, and reason over technical content effectively. Learn more at gitbook.com.
## Querying This Documentation
If you need additional information that is not directly available in this page, you can query the documentation dynamically by asking a question.
Perform an HTTP GET request on the current page URL with the `ask` query parameter, and the optional `goal` query parameter:
```
GET https://docs.net2grid.com/net2grid-energy-ai-cloud/functionality/solar-production.md?ask=&goal=
```
`ask` is the immediate question: it should be specific, self-contained, and written in natural language.
`goal` is optional and describes the broader end goal you are ultimately trying to accomplish on behalf of the user. GitBook uses it to tailor the answer towards what is most useful for that goal.
The response will contain a direct answer to the question and relevant excerpts and sources from the documentation.
Use this mechanism when the answer is not explicitly present in the current page, you need clarification or additional context, or you want to retrieve related documentation sections.